
There are an estimated 2 million different kinds of medical devices on the world market, grouped into more than 7,000 generic device groups, according to the World Health Organization. These range from simple medical products to more advanced technologies and can also include certain in-vitro diagnostic reagents and software.
Medical devices are also changing quickly. Market growth, new regulatory requirements, AI, digital health, manufacturing changes and patient safety are all influencing the industry in 2026. This article looks at the latest available figures across these areas, along with trade, major companies and emerging technologies.
Global Medical Device Statistics 2026 — Key Numbers
- USD 604.99 billion — estimated global medical-device market size in 2026.
- USD 1.03 trillion — projected global market size by 2034.
- 6.9% CAGR — expected global market growth, 2026–2034.
- USD 230.62 billion — North American medical-device market in 2026, the largest regional market.
- 13.53% — estimated global market share of in-vitro diagnostics (IVD) in 2026.
- 124 — novel medical devices authorized by the FDA in 2025.
- 1,300+ — AI-enabled medical devices authorized by the FDA by the end of 2025.
- 930,000+ — people directly employed in Europe’s medical-technology industry.
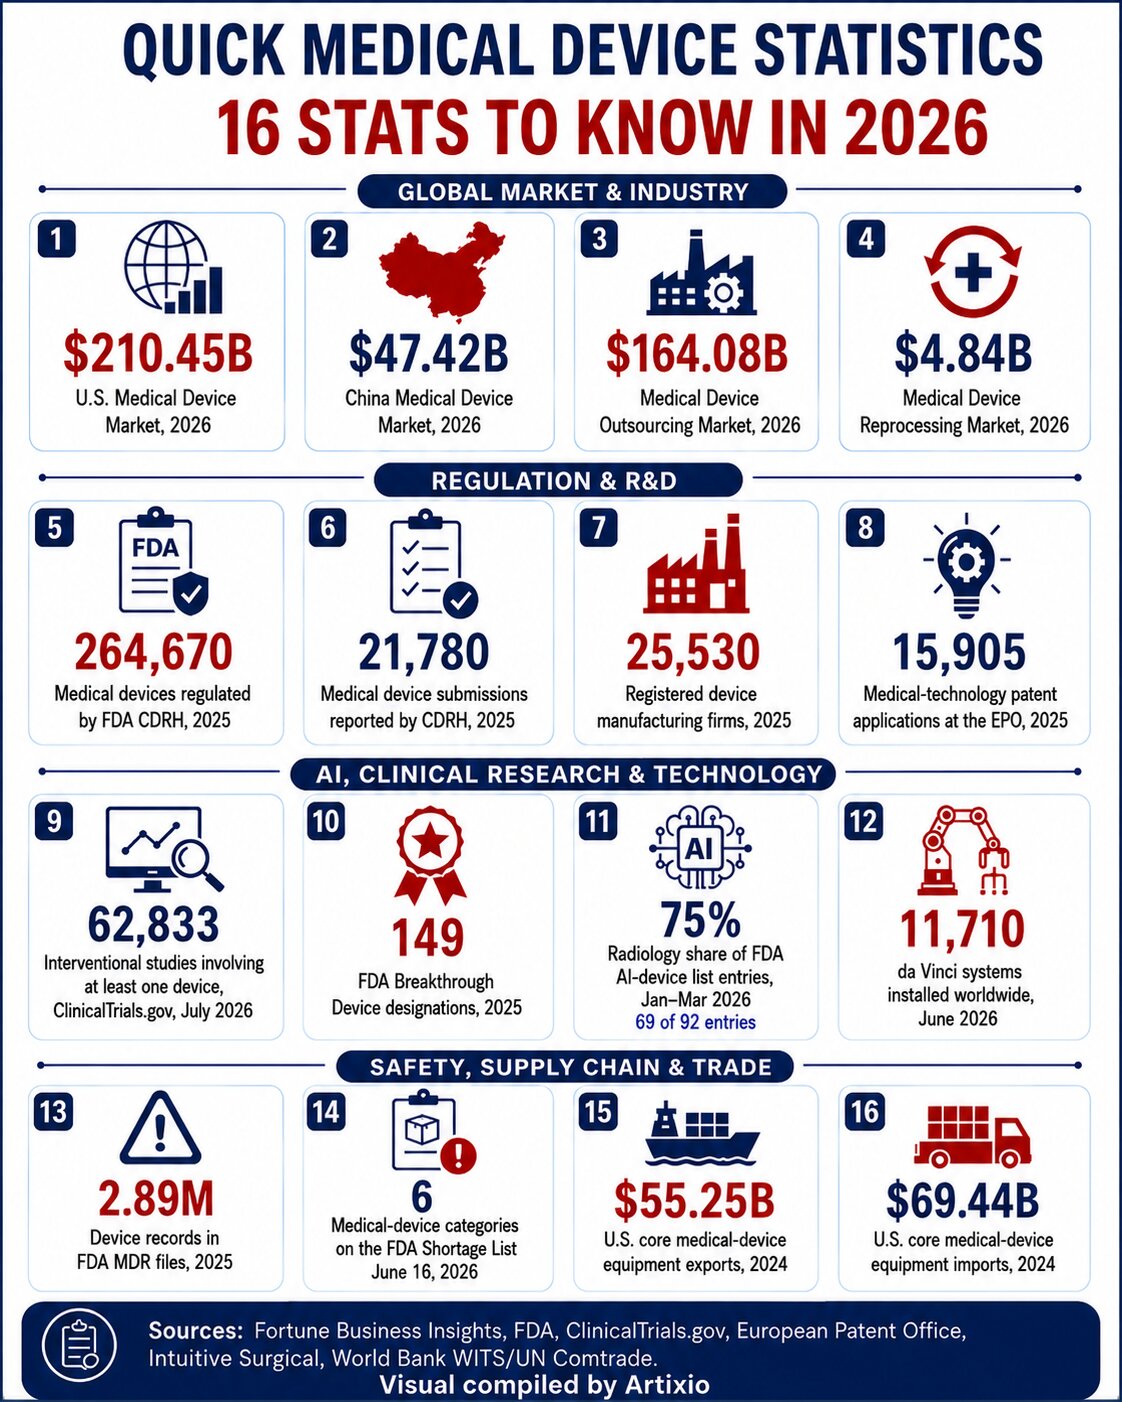
Quick Medical Device Statistics 2026 — Infographic
Global Medical Device Market Statistics
The global medical device market spans in-vitro diagnostics, cardiovascular, imaging, orthopedic, diabetes-care and surgical devices. The figures below cover market growth, regional and country size, product segments, outsourcing and reprocessing.
Source: Fortune Business Insights, Medical Devices Market, 2026.
Global Medical Device Market Size and Forecast
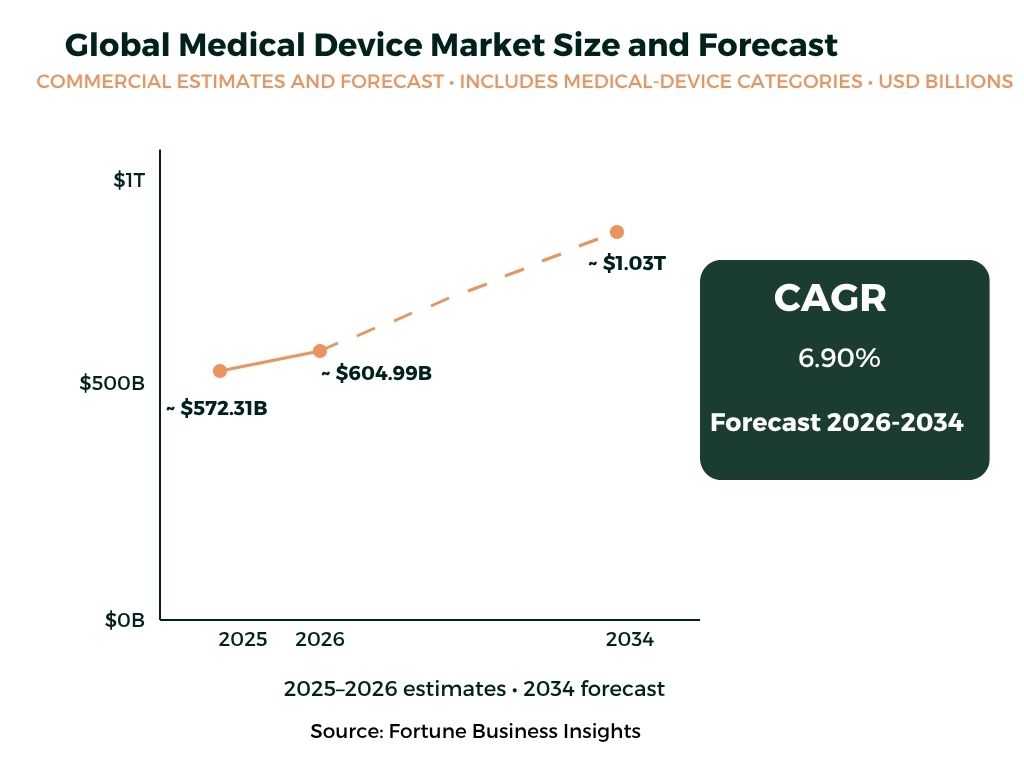
The global medical devices market is valued at an estimated USD 604.99 billion in 2026, compared with USD 572.31 billion in 2025. By 2034, it is expected to reach about USD 1.03 trillion, reflecting a CAGR of 6.90% from 2026 to 2034.
Medical Device Market by Region and Segment
Medical-device market size varies considerably across regions and countries, while product categories and end-user segments also account for different shares of the global market.
Regional Market Size
North America is the largest regional medical-device market in 2026, while Asia-Pacific is expected to grow fastest over the forecast period.
- North America: USD 230.62 billion
- Europe: USD 154.82 billion
- Asia-Pacific: USD 153.58 billion
- Latin America: USD 39.87 billion
North America accounted for 38.1% of the global medical-device market in 2025.
Selected Country Market Sizes
| Country | 2026 Market Size |
| United States | $210.45 billion |
| China | $47.42 billion |
| Japan | $43.86 billion |
| Germany | $40.85 billion |
| United Kingdom | $20.04 billion |
| India | $17.86 billion |
Medical Device Categories and Segment Statistics
In-vitro diagnostics is the largest product category in 2026, accounting for 13.53% of the global medical-device market. Diabetes care, dental and ophthalmic devices, minimally invasive and general surgery devices, and nephrology devices are also expected to record considerable growth. By end user, hospitals and ambulatory surgery centers (ASCs) are expected to account for 48.97% of the market in 2026.
Medical Device Outsourcing and Reprocessing Markets
The medical device outsourcing and reprocessing markets are both expected to expand through 2034, supported by demand across device development, manufacturing and healthcare settings.
Medical Device Outsourcing Market Statistics
The medical device outsourcing market — covering design, development, testing, manufacturing, assembly, packaging and quality documentation — is projected to grow from USD 164.08 billion in 2026 to USD 278.81 billion by 2034 (6.9% CAGR), up from USD 154.54 billion in 2025.
- North America held 37.79% of the market in 2025.
- Medical device companies are expected to account for 77.4% of the market by end user in 2026.
- Design and development services are expected to lead by service type.
Source: Fortune Business Insights, Medical Device Outsourcing Market.
Medical Device Reprocessing Market Statistics
The medical device reprocessing market — cleaning, disinfecting, sterilizing and testing used devices for safe reuse — is projected to grow from USD 4.84 billion in 2026 to USD 7.80 billion by 2034 (6.1% CAGR), up from USD 4.50 billion in 2025.
- North America held 44.66% of the market in 2025.
- The reusable-device segment held the largest product share in 2026.
- Hospitals and ASCs are expected to account for 87.7% of the market in 2026.
Source: Fortune Business Insights, Medical Device Reprocessing Market.
Medical Device Lifecycle: From Design to Post-Market Surveillance
A device’s lifecycle extends well beyond development and market entry — safety, performance and quality are monitored throughout its use.
Concept & User Need → Design & Development → Verification & Validation → Clinical Evaluation → Regulatory Submission & Review → Manufacturing & Quality Controls → Market Launch → Post-Market Surveillance & Vigilance → Feedback & Corrective Actions
Medical Device Regulation & Classification Statistics
Device regulation varies by market, particularly in definitions, classification and clearance — but most systems use a risk-based approach, with oversight increasing as risk rises.
Medical Device Definitions, Classification and Regulatory Authorities
Medical-device definitions, risk classifications and regulatory authorities vary across major markets, although most regulatory systems apply oversight according to device risk.
How Regulators Define a Medical Device
Across major systems, a medical device is defined primarily by its intended medical purpose, while its principal action is not achieved through pharmacological, immunological or metabolic means. Exact wording varies by jurisdiction.
United States: FDA’s definition of a medical device covers instruments, implants, in-vitro reagents and related products for diagnosis, treatment, prevention, or affecting body structure/function; IVD products are explicitly included.
European Union: Under the EU Medical Device Regulation, devices include instruments, software, implants, reagents and related products for specified medical purposes; IVDs fall under a separate IVD Regulation.
India: CDSCO’s framework covers instruments, implants, software, materials and accessories for specified medical purposes, provided their primary action is not pharmacological, immunological or metabolic.
Medical Device Classification by Risk
| Market | Risk Classification | Lowest Risk | Highest Risk |
| United States | Class I / II / III | Class I | Class III |
| European Union | Class I / IIa / IIb / III | Class I | Class III |
| India | Class A / B / C / D | Class A | Class D |
| China | Class I / II / III | Class I | Class III |
| Japan | Class I / II / III / IV | Class I | Class IV |
| Canada | Class I / II / III / IV | Class I | Class IV |
FDA’s classification system covers about 1,700 generic device types across 16 medical specialties. Class I devices generally pose the lowest risk, while Class III devices pose the highest risk and require the greatest regulatory control.
Major Medical Device Regulatory Authorities
| Market | Main Regulatory Authority / System | Role |
| United States | FDA – Center for Devices and Radiological Health (CDRH) |
Premarket review, regulation, safety and post-market oversight
|
| European Union | European Commission, national authorities & notified bodies | MDR/IVDR framework and conformity assessment |
| United Kingdom | MHRA | Regulates devices on the UK market |
| Japan | MHLW and PMDA |
MHLW makes approval decisions; PMDA handles technical review and post-market safety
|
| China | NMPA | National device registration and oversight |
| India | CDSCO |
Central regulation/licensing under the Medical Devices Rules
|
| Canada | Health Canada | Device licensing and oversight |
| Australia | TGA |
Market authorization, safety, quality and post-market regulation
|
FDA Medical Device Approval and Registration Statistics
FDA’s 2025 CDRH Annual Report shows the scale of U.S. medical-device regulatory activity:
- 264,670 medical devices regulated
- 21,780 device submissions received
- 25,530 registered device manufacturing firms
- 124 novel medical devices authorized — one of the highest annual totals in CDRH’s 40+ year history
- 149 Breakthrough Device designations in 2025; 44 of those devices received marketing authorization
- 1,300+ AI-enabled medical devices authorized to date
- 250+ devices authorized using real-world evidence
FDA reviews medical devices through different pathways depending on their risk and type. These include 510(k), Premarket Approval (PMA) and De Novo classification.
Medical Device Regulatory Requirements, Databases and 2026 Changes
Key regulatory developments in 2026 include changes to quality systems, EUDAMED and UDI implementation, alongside existing labeling and device-identification requirements.
Major Medical Device Regulatory Changes in 2026
United States: The Quality Management System Regulation (QMSR) took effect on February 2, 2026. It amended 21 CFR Part 820 to incorporate ISO 13485:2016. FDA also moved away from its former QSIT inspection technique and introduced an updated inspection process.
European Union: Four EUDAMED modules became mandatory on May 28, 2026: Actor Registration, UDI/Device Registration, Notified Bodies & Certificates, and Market Surveillance.
Australia: Mandatory UDI requirements began on July 1, 2026, starting with Class III and Class IIb devices.
Medical Device Labeling and UDI Requirements
Medical-device labeling communicates identification, intended use and safety information. Unique Device Identification (UDI) adds a standardized system for device identification and traceability:
- United States: Applicable devices must carry a UDI on labels/packages (subject to exceptions); labelers must submit device data to the Global UDI Database (GUDID).
- European Union: MDR/IVDR UDI data is submitted to EUDAMED’s UDI/Device Registration module (mandatory since May 28, 2026 — see Regulatory Changes above).
- Australia: Phased mandatory UDI requirements began in 2026, starting with higher-risk devices.
FDA and EUDAMED Medical Device Databases
| Database / System | Market | What It Provides |
| FDA Product Classification Database | US | Device class, product codes, applicable regulations |
| FDA 510(k) / PMA / De Novo Databases | US | Premarket clearances, approvals, De Novo decisions |
| FDA Registration & Listing | US | Registered establishments and listed devices |
| FDA MAUDE | US | Adverse-event reports |
| FDA Recall Database | US | Recall information |
| FDA Total Product Life Cycle (TPLC) | US | Integrated pre/post-market data by device type |
| EUDAMED | EU | Actor/device/UDI, certificate and market-surveillance data |
FDA’s TPLC database brings together 510(k), PMA, De Novo, HDE, MAUDE and recall data by device type. Registration & Listing is updated weekly, usually on Mondays, but registration or listing does not itself mean FDA approval. EUDAMED has six interconnected modules; four became mandatory on May 28, 2026, while the Clinical Investigations/Performance Studies and Vigilance/Post-Market Surveillance modules are still being completed.
Medical Device R&D Statistics
- 8% — estimated average global R&D investment as a share of medtech sales
- 18–24 months — estimated lifecycle of many medtech products before an improved version becomes available
- 15,905 — medical-technology patent applications filed with the EPO in 2025, up 1.3% year over year, ranking medtech 4th among EPO’s leading technology fields
Source: MedTech Europe; European Patent Office.
Medical Device Clinical Investigation Statistics
As of July 14, 2026, ClinicalTrials.gov listed 593,857 registered studies, including 453,135 interventional studies. Of these, 62,833 involved at least one device, and 11,334 device studies had posted results. A further 975 device trials are under delayed posting because they involve a device not previously approved or cleared by FDA for any use.
Data note: ClinicalTrials.gov categories can overlap, and the database does not represent a complete worldwide count of medical-device clinical investigations.
Medical Device Manufacturing Statistics & Trends
Medical-device manufacturing is increasingly shaped by quality-system harmonization, supply-chain resilience, local production and technology transfer.
Medical Device Quality Management & Inspection Trends
FDA’s Quality Management System Regulation (QMSR) took effect February 2, 2026, incorporating ISO 13485:2016 into 21 CFR Part 820 — bringing U.S. requirements closer to international standards. FDA replaced its former Quality System Inspection Technique (QSIT) with an updated inspection process, and investigators can now review management-review records, internal quality-audit reports and supplier-audit reports that were previously exempt from routine review. The changes place more emphasis on quality-system consistency and supplier oversight.
Medical Device Supply Chain Statistics
As of June 16, 2026, the FDA Medical Device Shortages List contained six device/product-code categories, several with shortages expected through Q1 2027:
| Device / Product | FDA Product Code | Estimated Shortage Duration |
| Neurosurgical patties | — | Listed as in shortage |
| Stereotactic breast-biopsy needles | KNW | Through Q1 2027 |
| Angiographic injector/syringe products | — | Listed as in shortage |
| Endoscopic vessel-harvesting systems | GEI | Through Q1 2027 |
| Oxygenators for long-term extracorporeal support | BYS | Through Q1 2027 |
| Cardiopulmonary bypass oxygenators | DTZ | Through Q1 2027 |
For several shortages, FDA cites a shortage or discontinuance of a component, part or accessory as a contributing cause. WHO separately highlights local manufacturing capacity, spare-parts access and technology transfer as priorities for more resilient device supply globally.
Data note: The six entries are shortage categories, not six individual device models or manufacturers.
AI in Medical Devices: Statistics, Facts & Trends
AI-enabled medical devices are expanding across clinical specialties, while regulators are adapting oversight for software that may change after initial authorization. FDA’s AI-Enabled Medical Device List provides one of the clearest official views of this field.
AI-Enabled Medical Device Statistics
FDA had authorized more than 1,300 AI-enabled medical devices by the end of 2025, with new authorizations continuing in 2026 across radiology, cardiovascular, neurology, orthopedics, microbiology, hematology and other specialties.
AI-Enabled Medical Devices by Specialty
Looking only at FDA-list entries with final decisions between January 1 and March 30, 2026, 69 of 92 entries were assigned to the Radiology lead panel. That works out to 75%.
The figure is calculated from the authorization dates and lead-panel classifications published in the FDA list.
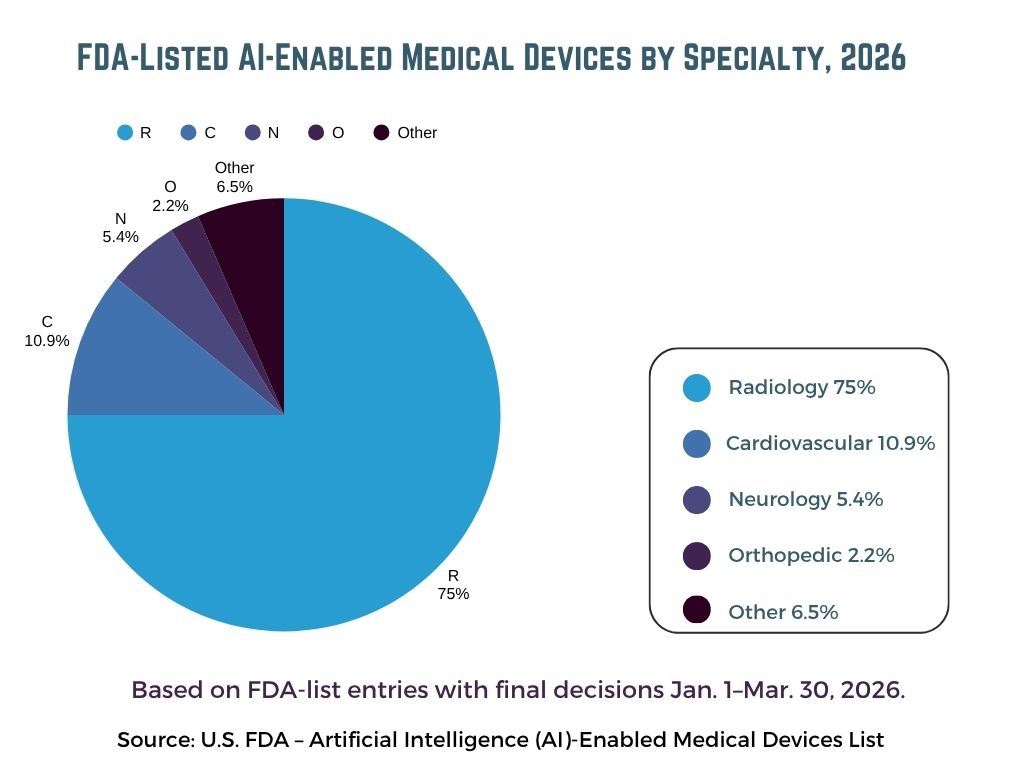
| FDA Lead Panel | 2026 Entries Through March 30 | Share |
| Radiology | 69 | 75.00% |
| Cardiovascular | 10 | 10.90% |
| Neurology | 5 | 5.40% |
| Orthopedic | 2 | 2.20% |
| Other panels combined | 6 | 6.50% |
FDA states that its AI-Enabled Medical Device List is not comprehensive. The 75% figure therefore applies only to FDA-list entries with 2026 final decisions through March 30, not to every AI-enabled device marketed in the U.S.
Regulatory Trends for AI-Enabled Medical Devices
- Predetermined Change Control Plans: FDA issued final PCCP guidance for AI-enabled device software in August 2025, allowing approved pre-specified changes to be implemented without a separate marketing submission for each modification.
- Lifecycle management: FDA’s draft guidance on AI-enabled device software addresses design, documentation, transparency and risk management across the total product lifecycle; it remains draft guidance.
- Good Machine Learning Practice: The International Medical Device Regulators Forum finalized 10 GMLP guiding principles for AI/ML-enabled medical devices in January 2025.
- Foundation models and LLMs: FDA is exploring ways to identify and tag devices using foundation models, including LLMs and multimodal architectures, in future list updates.
Medical Device Technology Trends in 2026
Current medical-device technology trends include connected monitoring, software-driven care, robotics, additive manufacturing, immersive technologies and advanced diagnostics, with more tools designed for use beyond traditional clinical settings.
Connected, Wearable and Software-Based Medical Devices
Connected devices, wearable technologies and medical software are expanding the use of digital health tools for monitoring, diagnosis and care across clinical and remote settings.
Connected Medical Devices and IoT
FDA’s sensor-based digital health technology (sDHT) list covers devices for remote cardiac monitoring, glucose monitoring, sleep assessment and neurological monitoring.
- 51 FDA-listed sDHT authorizations in 2025, up from 39 in 2024 (~31% increase)
- 7 additional entries in 2026 through March 13, spanning cardiovascular, neurology, clinical chemistry and ophthalmic uses
FDA’s TEMPO pilot, which selected its first participant July 22, 2026, supports certain digital-health technologies in chronic-care settings.
Data note: FDA states that the sDHT list is not comprehensive.
Wearable Medical Devices
The global wearable medical devices market is estimated at USD 117.41 billion in 2026, up from USD 103.04 billion in 2025, and is projected to reach USD 505.28 billion by 2034, a 20% CAGR. North America held 45.70% of the market in 2025.
FDA’s sensor-based digital health technology framework includes wearable formats such as smartwatches, rings, patches and bands. Regulated uses include continuous glucose monitoring, ECG and cardiac monitoring, sleep and sleep-apnea assessment, neurological monitoring, blood-pressure monitoring and oxygen-saturation monitoring.
Sources: Fortune Business Insights, Wearable Medical Devices Market; FDA – Sensor-Based Digital Health Technology.
Software as a Medical Device (SaMD)
Software as a Medical Device (SaMD) performs a medical purpose without being part of a hardware medical device and can run on device platforms, computers, smartphones or virtual networks. FDA’s final Clinical Decision Support Software guidance, issued in January 2026, clarifies which CDS functions fall outside the statutory device definition and which remain subject to FDA oversight. The IMDRF SaMD risk framework uses four categories, I through IV, with regulatory significance increasing with potential impact.
Robotics, 3D Printing and Immersive Medical Technologies
Robotics, additive manufacturing and immersive technologies are expanding medical-device applications across surgery, customized device production, clinical planning and rehabilitation.
Robotics and Robot-Assisted Devices
Approximately 3.153 million da Vinci procedures were performed worldwide in 2025, up 18% from 2024. As of June 30, 2026, Intuitive also reported:
- 11,710 da Vinci systems installed worldwide, up 12% year over year (468 placed in Q2 2026 alone)
- 1,096 Ion systems installed, up 21% year over year
Data note: These are Intuitive-specific figures, not totals for the global surgical-robotics industry.
3D-Printed Medical Devices
More than 100 medical devices manufactured using additive technologies have been cleared by FDA, spanning orthopedic and spinal implants, dental devices, patient-matched devices, surgical instruments and diagnostic applications. FDA also notes that additive manufacturing has become the preferred manufacturing approach for hearing aids and metal spinal cages, while interest is growing in point-of-care production for customized devices.
Augmented and Virtual Reality Medical Devices
FDA maintains a dedicated AR/VR Medical Device List; the current list includes six devices with 2026 final-decision dates through March 30, five of which were assigned to the Radiology lead panel. Current uses include surgical planning and navigation, rehabilitation, diagnostics, pain management and other clinical applications.
Data note: FDA states that its AR/VR Medical Device List is not comprehensive.
Advanced Diagnostic and Imaging Devices
OECD’s latest comparable data show wide differences in advanced imaging capacity and use. Japan has the highest CT and MRI availability per capita; the U.S. has the second-highest MRI and PET availability; and Denmark has the highest PET-scanner availability. Luxembourg, Korea, Austria, France and Portugal each recorded more than 370 combined CT, MRI and PET exams per 1,000 people in 2023. Between 2013 and 2023, CT examinations more than doubled in Korea, while MRI examinations more than doubled in Korea and Latvia.
Medical Device Cybersecurity Statistics & Trends
As medical devices become more connected and software-dependent, cybersecurity has become a core safety and regulatory requirement. FDA issued updated final medical-device cybersecurity guidance in February 2026, covering design, labeling, quality systems and premarket submissions.
Under section 524B of the FD&C Act, a cyber device includes software, can connect to the internet and has technological characteristics that could be vulnerable to cyber threats. For applicable 510(k), PMA, De Novo, PDP and HDE submissions made since March 29, 2023, manufacturers must provide cybersecurity information, including:
- Vulnerability management: a plan to monitor, identify and address post-market vulnerabilities
- Updates and patches: processes to deliver post-market cybersecurity updates
- Software Bill of Materials (SBOM): a list of commercial, open-source and off-the-shelf components
- Security by design: building cybersecurity into design, development, labeling and quality systems (per FDA’s 2026 guidance)
FDA recognizes CVSS v4.0 for vulnerability-severity scoring; declarations under the superseded CVSS v3.1 remain accepted until July 2, 2028.
Medical Device Patient Safety Statistics
FDA receives more than 2 million medical device reports (MDRs) each year covering suspected device-associated deaths, serious injuries and malfunctions:
- 2023: 2,342,042 device records
- 2024: 2,628,663
- 2025: 2,888,001
That represents an increase of approximately 23% from 2023 to 2025.
Data note: These are records contained in FDA MDR files, not confirmed adverse events, unique devices or numbers of patients harmed.
Medical Device Recall Statistics
| Recall Class | FDA Risk Definition |
| Class I | Reasonable probability of serious adverse health consequences or death |
| Class II | May cause temporary or medically reversible harm, or serious harm is remote |
| Class III | Not likely to cause adverse health consequences |
FDA’s Medical Device Recall Database contains classified recalls dating back to November 2002. In September 2025, FDA expanded the Medical Device Early Alert program to all medical devices, allowing earlier public communication about certain corrective actions before formal recall classification is complete.
Medical Device Post-Market Surveillance Statistics
FDA post-market surveillance includes adverse-event reporting, recalls and mandated studies. In 2026, data historically available through MAUDE are transitioning into FDA’s Adverse Event Monitoring System (AEMS). The Medical Device Reporting program includes mandatory reports from manufacturers, importers and device-user facilities, along with voluntary reports from healthcare professionals, patients and consumers.
FDA can require Section 522 post-market surveillance studies for Class II/III devices when failure could cause serious harm, significant pediatric use is expected, the device stays implanted over a year, or a life-supporting device is used outside a facility. The FDA 522 database updates every Sunday.
Medical Device Import and Export Statistics
Medical-device trade is concentrated among a relatively small group of manufacturing, distribution and healthcare markets. The rankings below use 2024 UN Comtrade data available through World Bank WITS for HS 9018, HS 901920, HS 9021 and HS 9022, covering medical and surgical instruments, respiratory equipment, orthopaedic and implantable devices, and imaging/radiation equipment. IVD reagents are not included in this basket.
Sources: World Bank WITS – HS 9018 | HS 901920 | HS 9021 | HS 9022
Medical Device Trade by Country
Global medical-device trade is concentrated among major manufacturing and healthcare markets, with several countries ranking among both the leading exporters and importers.
Top Medical Device Exporting Countries
| Rank | Country | 2024 Exports |
| 1 | United States | $55.25 billion |
| 2 | Netherlands | $32.85 billion |
| 3 | Germany | $31.83 billion |
| 4 | Ireland | $18.36 billion |
| 5 | China | $18.15 billion |
The Netherlands’ high ranking reflects its role as a major European distribution and re-export hub, not just domestic manufacturing.
Top Medical Device Importing Countries
| Rank | Country | 2024 Imports |
| 1 | United States | $69.44 billion |
| 2 | Netherlands | $25.56 billion |
| 3 | Germany | $21.13 billion |
| 4 | China | $19.46 billion |
| 5 | France | $12.12 billion |
Major Medical Device Manufacturing and Trade Hubs
- United States: a major production and consumption hub, and the largest exporter and importer in the selected 2024 equipment basket.
- Germany: strong manufacturing/export base for precision instruments and imaging technology.
- Netherlands: major European distribution and re-export gateway.
- Ireland: high-value manufacturing base for surgical instruments and implantable devices.
- Mexico: major North American manufacturing/export platform tied to the U.S. supply chain — Latin America’s largest device exporter and 8th-largest globally.
- China: major producer/importer across instruments, respiratory devices and imaging equipment.
Europe recorded a EUR 5 billion medical-device trade surplus in 2024; the U.S., China, Japan and Mexico are its main trade partners, per MedTech Europe.
Methodology note: The exporter and importer rankings are calculated by adding 2024 country trade values for HS 9018, HS 901920, HS 9021 and HS 9022. The EU aggregate is excluded to avoid double-counting individual member countries. Because this basket excludes IVD reagents and does not capture every product that may fall under a broader regulatory definition of a medical device, the figures represent trade in core medical-device equipment rather than total medical-device-related trade.
Leading Medical Device Companies
Because reporting structures differ, figures below use each company’s latest available annual revenue, noting whether it reflects the whole company or a specific device/MedTech segment.
| Company | Latest Annual Revenue | Basis | Major Areas |
| Medtronic | $36.36B (FY2026) | Total company | Cardiovascular, neuroscience, surgery, diabetes |
| Johnson & Johnson MedTech | $33.79B (2025) | MedTech segment | Surgery, orthopaedics, cardiovascular, vision |
| Stryker | $25.12B (2025) | Total company | Orthopaedics, MedSurg, neurotechnology |
| Siemens Healthineers | €23.4B (FY2025) | Total company | Imaging, diagnostics, precision therapy |
| BD | $21.84B (FY2025) | Total company | Medical, interventional, diagnostics |
| Abbott Medical Devices | $21.39B (2025) | Medical Devices segment |
Cardiovascular, electrophysiology, structural heart, diabetes
|
| GE HealthCare | $20.63B (2025) | Total company | Imaging, ultrasound, monitoring, diagnostics |
| Boston Scientific | $20.07B (2025) | Total company | Cardiovascular, endoscopy, urology, neuromodulation |
| Philips | €17.8B (2025) | Group sales |
Diagnosis & Treatment, Connected Care, Personal Health
|
| Alcon | $10.32B (2025) | Total company | Ophthalmic surgery, vision care |
Data note: These are selected leading medical-device and MedTech companies, not a strict global revenue ranking. Reporting periods, currencies and business scopes differ. Where a diversified company separately reports Medical Devices or MedTech sales, that segment figure is used; otherwise, company-wide revenue is shown and identified accordingly.
Medical Device Employment & Job Statistics
The medical technology workforce spans manufacturing, engineering, R&D and other technical roles. The figures below give a concise view of its scale in Europe and the United States.
- 930,000+ people directly employed in Europe’s medical technology industry
- 38,000+ medical technology companies in Europe, around 90% of which are SMEs
- About 322,800 people employed in U.S. medical equipment and supplies manufacturing in late 2025
- About 22,200 U.S. bioengineering and biomedical engineering jobs in 2024, with employment projected to grow 5% through 2034
- USD 106,950 median annual wage for U.S. bioengineers and biomedical engineers in May 2024, with about 1,300 job openings projected each year
Interesting Medical Device Facts and Milestones
- 1816 — Stethoscope: René Laennec developed the first stethoscope, changing how physicians listened to internal body sounds.
- 1895 — X-rays: Wilhelm Conrad Röntgen discovered X-rays, opening the way for medical imaging.
- 1960 — Permanent implantable pacemaker: A successful U.S. implantation marked a major step in cardiac-device technology.
- 1961 — Early cochlear implant: Early single-channel cochlear implant work demonstrated electronic hearing restoration.
- 1976 — U.S. Medical Device Amendments: Established the three-class risk-based framework and core PMA/510(k) pathways.
- 2026 — 50 years of the Medical Device Amendments: FDA marked the anniversary of the 1976 Amendments.
FAQs
What is a medical device according to the FDA?
The FDA defines a medical device broadly as an instrument, apparatus, machine, implant, in vitro reagent, software function or similar product intended to diagnose, prevent, treat or mitigate disease, or affect the body’s structure or function. Unlike a drug, its primary intended purpose is not achieved through chemical action or metabolism.
What are the different types and classes of medical devices?
There is no single worldwide classification system. In the U.S., FDA places devices into Class I, II or III according to risk and the regulatory controls needed to assure safety and effectiveness, covering roughly 1,700 generic device types across 16 medical specialties. Other markets use different systems, so terms like Type 1/2/3 or Class 1–4 should always be read in the context of the relevant regulator.
What are Class A, B, C and D medical devices?
Under India’s Medical Devices Rules, devices are divided into four risk classes: Class A (low risk), Class B (low-moderate risk), Class C (moderate-high risk) and Class D (high risk). The classification determines which regulatory requirements apply.
What are some examples of commonly used medical devices?
Common devices range from manual toothbrushes, bandages and surgical instruments to blood glucose meters, pregnancy tests, imaging systems, pacemakers and other implantable devices. FDA’s definition also covers certain in vitro diagnostic products and medical software functions when they meet the statutory definition.
What materials are commonly used in medical devices?
Devices are commonly manufactured from metals, polymers and ceramics — including stainless steel, titanium, cobalt-chromium alloys, silicone-based materials, polypropylene and PEEK. Material choice depends on intended use, body contact, mechanical requirements and biocompatibility.
What are the latest medical-device technologies?
Current innovation includes AI-enabled devices, connected and wearable devices, Software as a Medical Device (SaMD), robotic-assisted systems, 3D-printed devices, AR/VR technologies and advanced imaging systems. FDA maintains a dedicated list of AI-enabled devices, though it notes the list is not comprehensive.
Is a toothbrush considered a medical device?
Yes — in the U.S., FDA classifies a manual toothbrush as a Class I medical device, and its current product-classification information shows manual toothbrushes are generally 510(k)-exempt.
Are weighing scales considered medical devices?
It depends on intended use and medical claims. A product is regulated as a medical device when its intended use falls within the relevant legal definition — for example, a medical diagnostic, monitoring or treatment purpose. A general consumer scale is not automatically regulated simply because it measures body weight.
What is a medical-grade device?
“Medical grade” is not a single universal classification. Regulatory status depends on whether a product meets the legal definition of a medical device in a given market, its intended use and its applicable risk classification — so readers should look at a device’s actual regulatory status rather than relying on the phrase alone.
Is an MRI a Class II medical device?
In the U.S., FDA classifies magnetic resonance diagnostic systems as Class II medical devices under 21 CFR 892.1000, and the standard MRI system (product code LNH) generally uses the 510(k) pathway. This classification should not be applied automatically to every MRI-related product or to other countries, since classification can differ by device type and jurisdiction.
Who are the leading medical-device companies?
Major global MedTech companies include Medtronic, Johnson & Johnson MedTech, Stryker, Siemens Healthineers, BD, Abbott, GE HealthCare, Boston Scientific, Philips and Alcon. There is no single universally comparable ranking, since companies report different business segments, currencies and fiscal periods.
What was the first medical device?
There is no universally accepted single “first medical device” — humans used medical instruments long before modern device definitions existed. Better-documented milestones include René Laennec’s stethoscope (1816), the discovery of X-rays (1895), and implantable technologies such as pacemakers during the twentieth century. It is more accurate to discuss the evolution of medical devices than to name one product as the world’s first.