Global pharmaceutical market is estimated at $1.837 trillion in 2026 — but no medicine reaches that market instantly. It advances through research, preclinical development, clinical trials, regulatory review, manufacturing, and continuous post-market oversight. Each stage generates important data that reveals how the global pharmaceutical industry is evolving.
In this blog, we compile the latest pharmaceutical statistics, trends, facts and market insights.
Global Pharmaceutical Market Statistics & Trends
- Global pharmaceutical market is valued at $1.837 trillion in 2026.
- Pharmaceuticals market is projected to reach $2.777 trillion by 2033.
- Pharma industry is expected to grow at a 7% CAGR through 2033.
- North America holds 41.8% of the global pharmaceutical market.
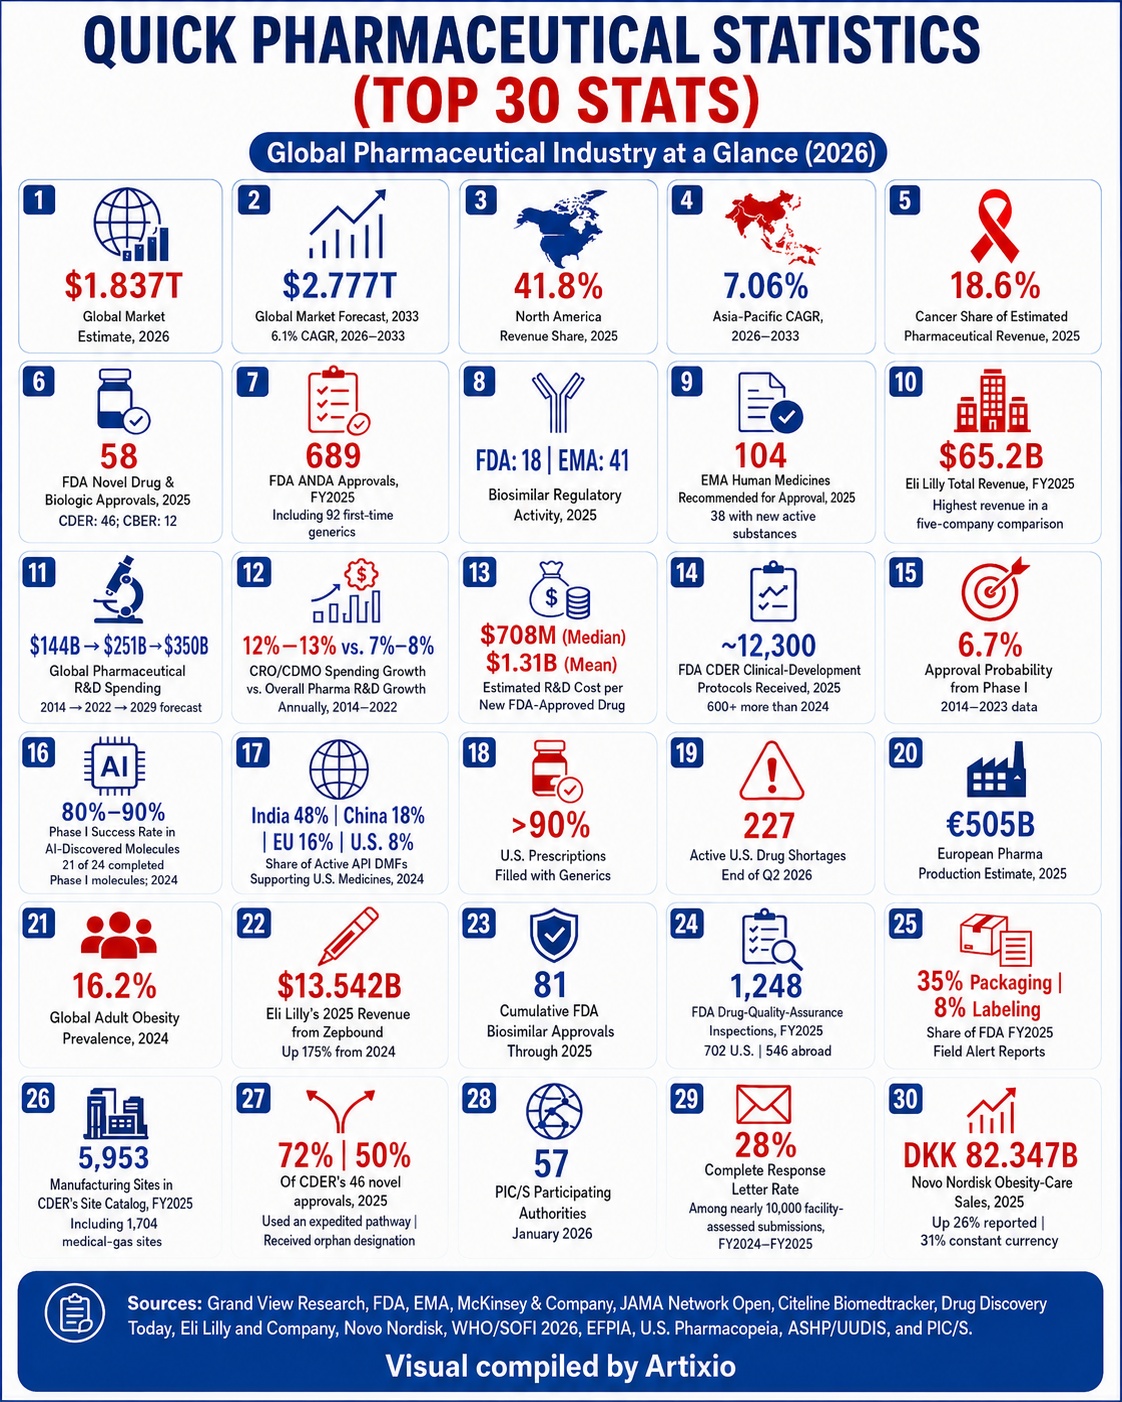
Quick Pharmaceutical Statistics (Top 30 Pharma Stats)
Global Pharmaceutical Regulatory Overview
Pharmaceutical products are regulated by national health authorities worldwide to ensure their quality, safety, efficacy, and ongoing compliance throughout the product lifecycle.
Major Pharmaceutical Regulatory Authorities
| Jurisdiction | Authority | Full name |
Reference milestone/year
|
| United States | FDA | U.S. Food and Drug Administration | 1906* |
| European Union | EMA | European Medicines Agency | 1995 |
| United Kingdom | MHRA | Medicines and Healthcare products Regulatory Agency | 2003 |
| Japan | PMDA | Pharmaceuticals and Medical Devices Agency | 2004 |
| China | NMPA | National Medical Products Administration | 2018* |
| India | CDSCO | Central Drugs Standard Control Organisation | 1940/1945* |
| Australia | TGA | Therapeutic Goods Administration | 1989 |
| Canada | Health Canada | Health Canada | 1996 |
| Brazil | Anvisa | Brazilian Health Regulatory Agency | 1999 |
| Saudi Arabia | SFDA | Saudi Food and Drug Authority | 2003 |
*The FDA’s modern regulatory functions date to the 1906 Pure Food and Drugs Act; the present FDA name was adopted in 1930. China’s 2018 date refers to the current NMPA structure. For India, 1940 and 1945 refer to the Drugs and Cosmetics Act and Rules governing CDSCO’s central regulatory functions.
Pharmaceutical Regulatory Compliance Trends & Facts
Pharmaceutical regulation starts before a single patient takes a dose, and it doesn’t end at approval — it runs for as long as the medicine is on the market, covering everything from trial authorization to labeling to ongoing safety checks.
Drug submissions are not isolated regulatory events. They form part of a connected product lifecycle involving multiple submission types, documentation standards, review pathways, and post-approval obligations.
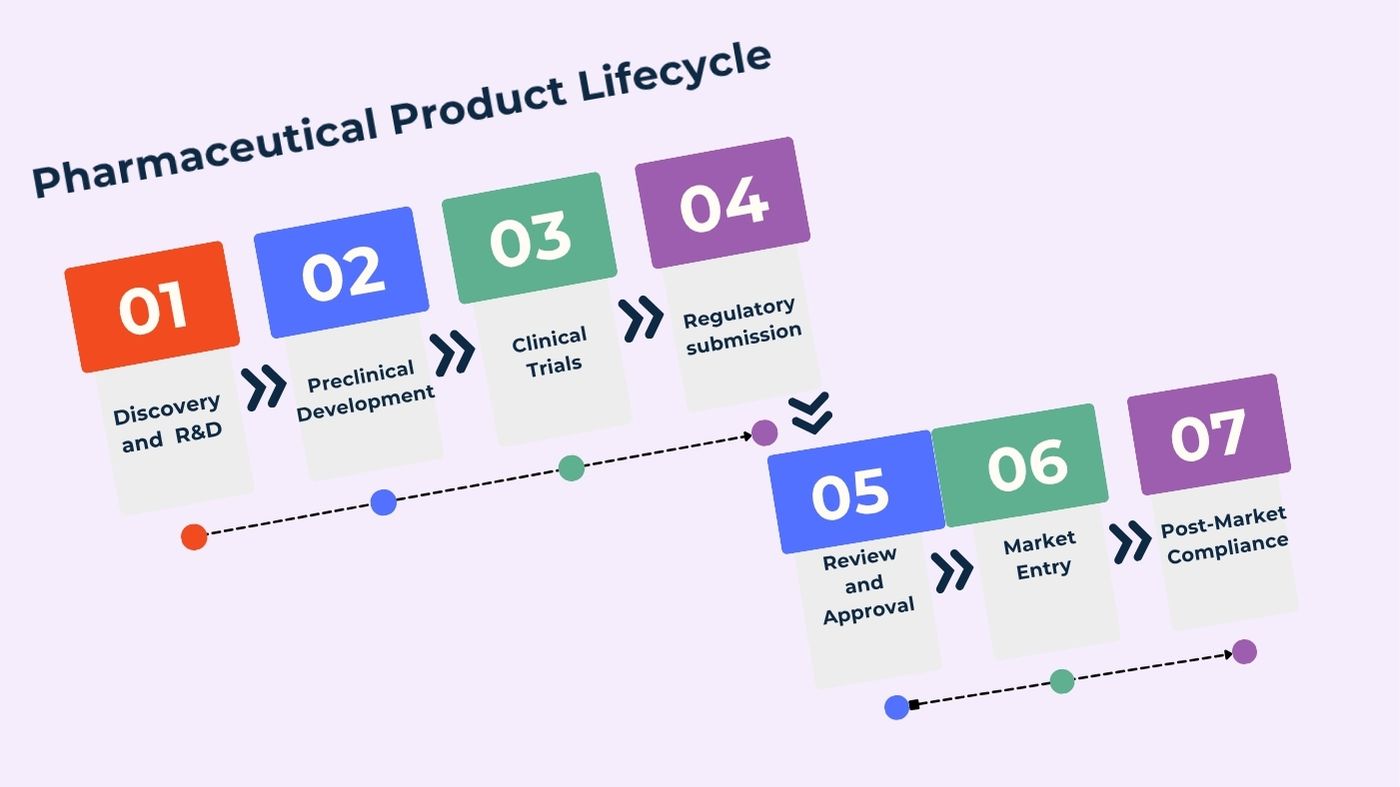
Pharmaceutical Product Lifecycle Compliance Journey
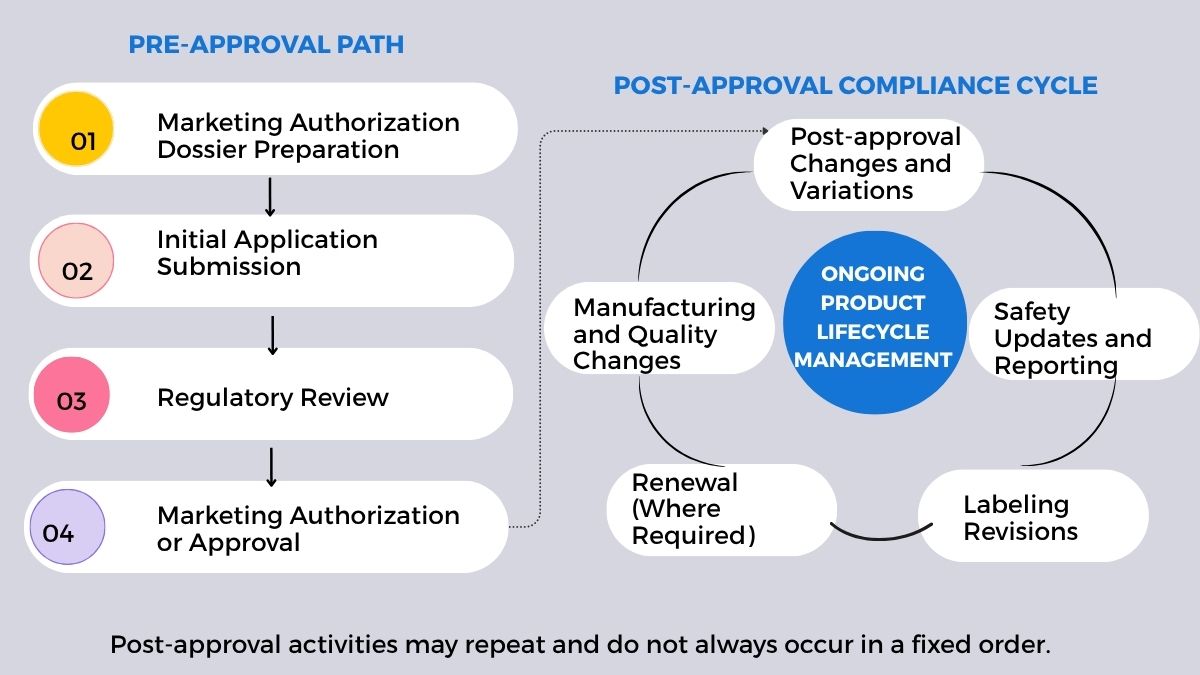
The visual above shows the full regulatory pathway for a new medicine. Generic medicines follow a related but abbreviated route based on an already approved reference medicine. The manufacturer submits an ANDA or equivalent generic application demonstrating appropriate quality, pharmaceutical equivalence, and bioequivalence. After approval, the generic medicine remains subject to ongoing post-approval lifecycle management.
Pharma Clinical Trial Regulatory Statistics
- Clinical trials generally require regulatory authorisation or clearance and ethics committee approval before participant enrolment begins, subject to national requirements.
- ICH E6(R3) Good Clinical Practice is the internationally recognised standard for designing, conducting, recording and reporting clinical trials.
- More than 593,000 registered studies across 226 countries and territories were listed on ClinicalTrials.gov as of 14 July 2026.
- Public trial-registration and results-disclosure requirements continue to expand across regulatory and research frameworks.
Common Pharmaceutical Submission Types
| Submission Type | Typical Purpose |
| Clinical Trial Application (CTA) / IND |
Authorization to begin clinical studies
|
| Initial Marketing Authorisation (MAA/NDA/BLA) |
First authorization to market a medicine
|
| Generic Drug Application (ANDA) |
Approval for a generic medicine
|
| Post-approval Variation / Supplement |
Update an approved medicine’s details
|
| CMC Change |
Report manufacturing or quality changes
|
| Labeling Update |
Revise warnings, dosage, or product info
|
| Periodic Safety Report (PSUR/PBRER) |
Cumulative post-authorization safety review
|
| Renewal |
Maintain marketing-authorization validity
|
CTD and eCTD Submission Standards
Marketing applications are organised according to the CTD structure and are generally submitted electronically in eCTD format.
- The Common Technical Document comprises five modules. Module 1 is region-specific, while Modules 2–5 follow a common structure across ICH regions.
- FDA’s CDER and CBER have accepted new regulatory applications in eCTD v4.0 format since September 16, 2024. FDA currently supports both eCTD v3.2.2 and v4.0; v4.0 is not yet the exclusive required version.
- In the EU, applicants have been able to use eCTD v4.0 optionally for new marketing-authorisation applications for centrally authorised products since December 22, 2025. eCTD v3.2.2 remains accepted during the transition period. EU eCTD v4.0 Validation Criteria v1.1 became applicable on July 15, 2026. Strongly recommended use is planned from Q1 2027, followed by mandatory use for new centrally authorised marketing-authorisation applications from Q1 2028.
Drug Approval Statistics 2025
- 58 combined novel approvals — 46 from CDER (34 new molecular entities + 12 biologics) and 12 from CBER.
- ~72% of CDER’s 46 novel approvals used at least one expedited pathway; 50% received orphan drug designation.
- 18 new biosimilars approved by FDA, bringing the cumulative total to 81 approvals at the end of the year.
- 104 EMA recommendations for marketing authorization — 38 involving a new active substance, 16 for rare diseases and 41 biosimilar products.
- 689 ANDA approvals were recorded by the FDA in FY2025, including 92 first-time generic approvals.
- Generic drugs account for more than 90% of prescriptions filled in the United States.
Pharmaceutical Labeling and Packaging Statistics
Pharmaceutical labels and packaging communicate essential product information, support safe medicine use, and help regulators and supply chain partners identify and trace products. Requirements differ across countries, so labels and packaging often need market-specific adaptation.
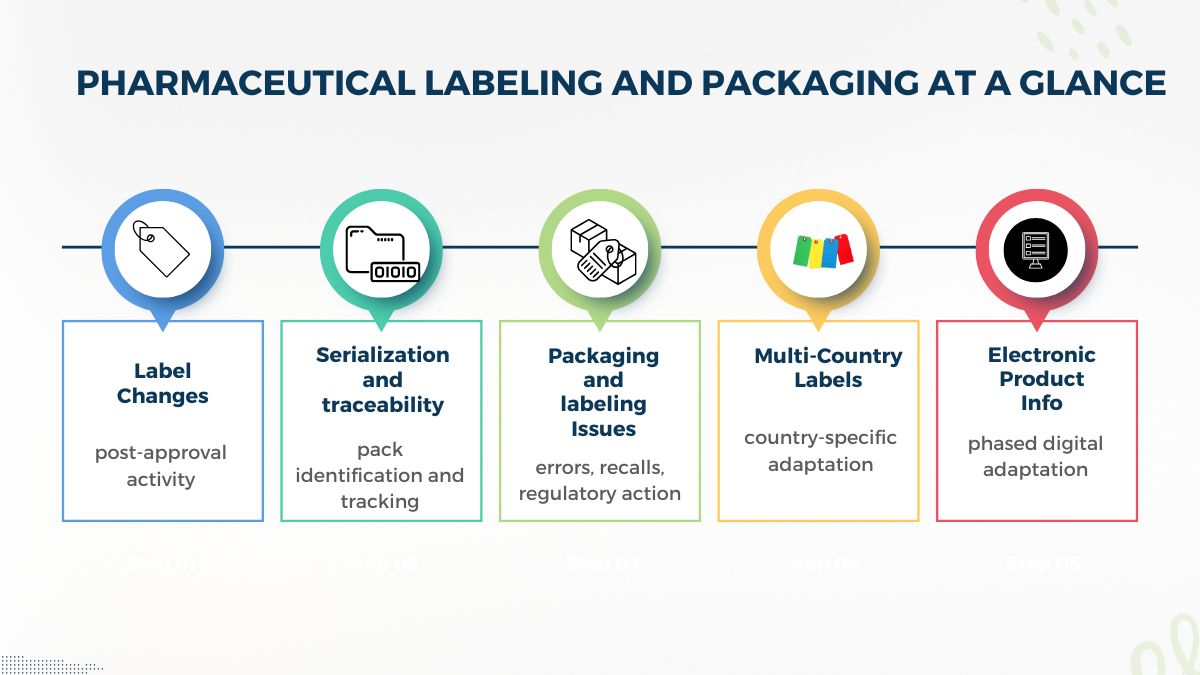
Common Pharmaceutical Labeling Elements
| Label component |
Typical requirement
|
| Product name |
Generally required
|
| Active ingredient |
Generally required
|
| Strength |
Generally required
|
| Dosage form |
Generally required
|
| Route of administration |
Required where applicable
|
| Batch or lot number |
Generally required
|
| Expiry date |
Generally required where applicable
|
| Storage conditions | Product-specific |
| Manufacturer, MAH or distributor details | Market-specific |
| Warnings and precautions |
Product- and market-specific
|
| Barcode or serialization data | Market-specific |
Note: Exact labeling requirements vary according to the product type, package level, and national or regional regulations.
Global Pharmaceutical Labeling and Packaging Facts
- GS1 DataMatrix standards support pharmaceutical identification and traceability requirements in more than 70 countries.
- Since February 2019, most prescription and certain non-prescription medicines in the EU require a 2D Data Matrix code and an anti-tampering device.
- The U.S. DSCSA requires electronic, package-level tracing of prescription medicines.
- In FDA FY2025 Field Alert Reports, packaging issues were the largest category at 35%, while labeling issues accounted for 8%.
Pharmaceutical GMP and Inspection Statistics
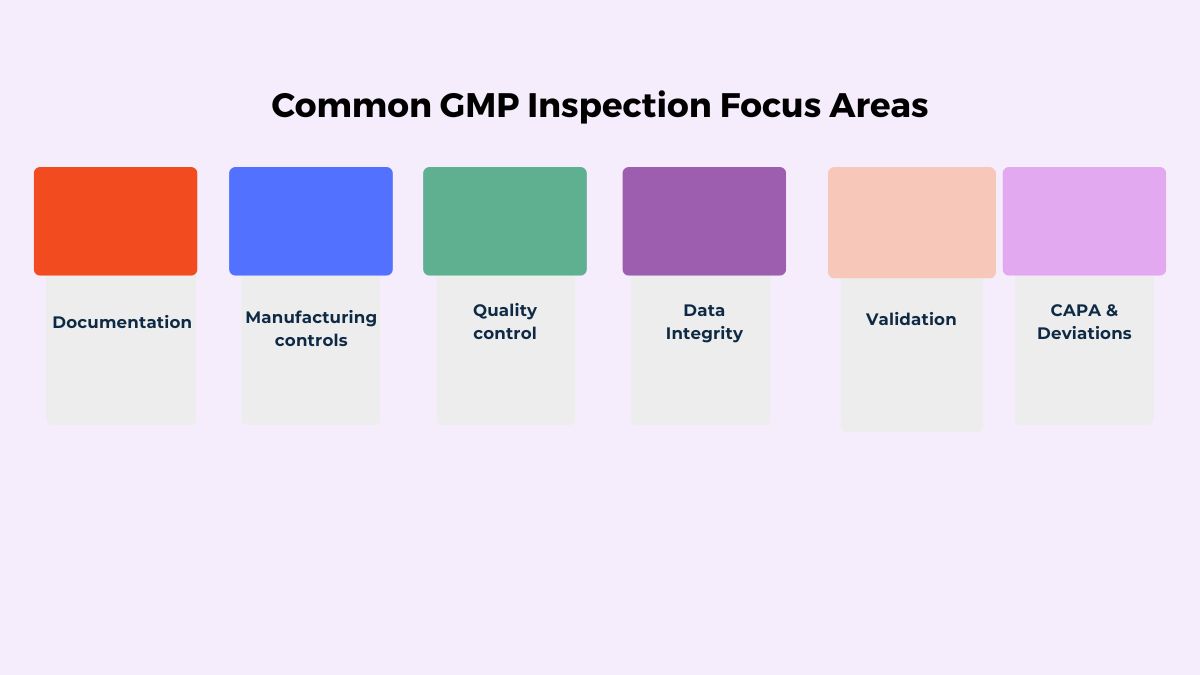
Pharmaceutical manufacturers must comply with applicable GMP requirements. Regulators inspect both domestic and overseas facilities using surveillance, risk-based, and for-cause approaches. FDA uses facility compliance history, product risk, recalls, and other quality signals when prioritising inspections.
- PIC/S comprised 57 Participating Authorities as of January 2026, supporting the harmonisation of GMP inspection procedures and inspector training worldwide.
- 1,248 FDA drug-quality-assurance inspections in FY2025—702 in the United States and 546 abroad.
- 5,953 manufacturing sites were included in CDER’s Site Catalog at the end of FY2025, including 1,704 medical-gas manufacturing sites.
- Among nearly 10,000 facility-assessed submissions received during FY2024–FY2025, 28% had received a Complete Response Letter as of May 2026; 43% of those CRLs were due to facility withholds.
Serious GMP deficiencies may result in warning letters, recalls, import alerts, application withholds, seizures, or injunctions.
Pharmaceutical Regulatory Intelligence Statistics
Pharmaceuticals Regulatory Intelligence Process
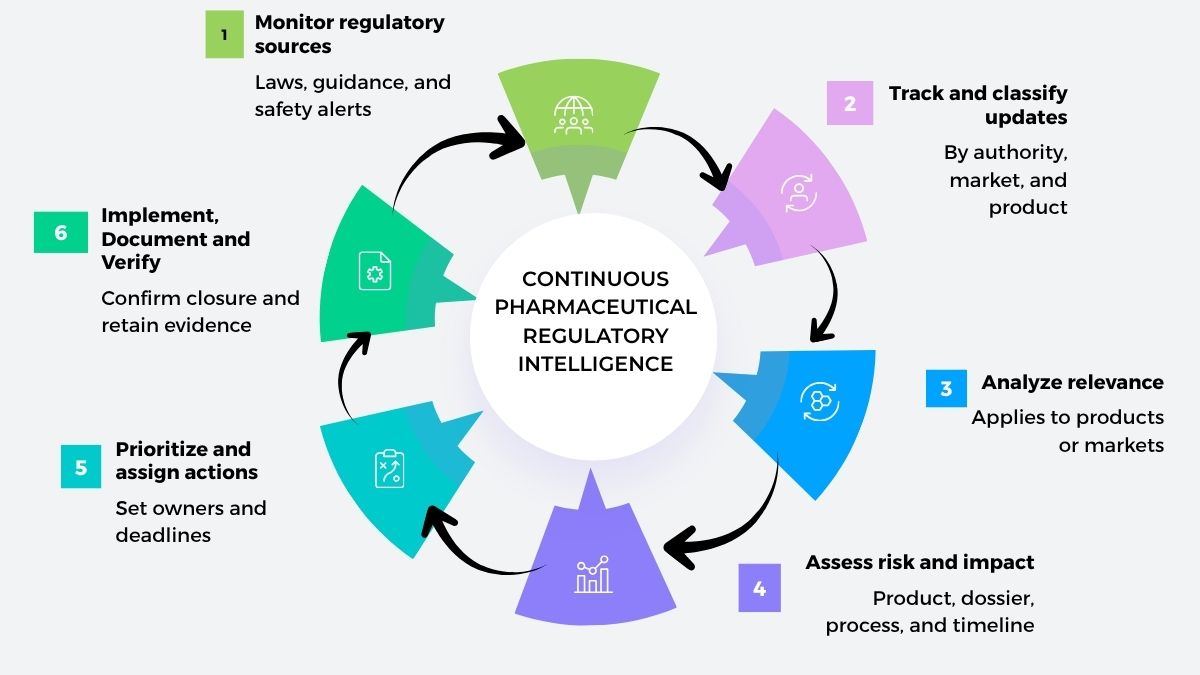
Common Pharmaceutical Regulatory Risks
| Regulatory risk | Potential impact |
| Documentation gaps |
Review or approval delays
|
| Data-integrity deficiencies |
GMP observations or regulatory action
|
| Manufacturing non-compliance |
Warning letters, import restrictions or recalls
|
| Labeling deficiencies |
Safety actions, corrections or recalls
|
| Unreported post-approval changes |
Compliance action or impact on approval status
|
AI in Pharmaceutical Regulatory Affairs: Statistics and Trends
Pharmaceutical companies and regulatory authorities are increasingly using AI for document analysis, knowledge mining, risk identification, submission review, and regulatory decision support. Its applications extend across nonclinical research, clinical development, manufacturing, and post-marketing activities.
- 500+ drug and biologic submissions containing AI components were handled by FDA’s CDER between 2016 and 2023.
- More than 70% of FDA staff voluntarily used the agency’s internal AI tool, Elsa, following its initial deployment.
- 10 guiding principles for AI across the medicines lifecycle were published jointly by FDA and EMA in January 2026.
- EMA’s Data and AI workplan extends through 2028.
Global Pharmaceutical Market Statistics
Approval is a start line, not a finish line — oversight doesn’t stop, but a whole new set of forces takes over: demand, competition, pricing, patient need. Here’s how that plays out in the numbers: market growth, which regions and diseases dominate, what’s driving demand right now, and who’s leading the pack.
A pharmaceutical product typically moves from R&D to the market through a broadly similar process:
Global Pharmaceutical Market Size and Forecast
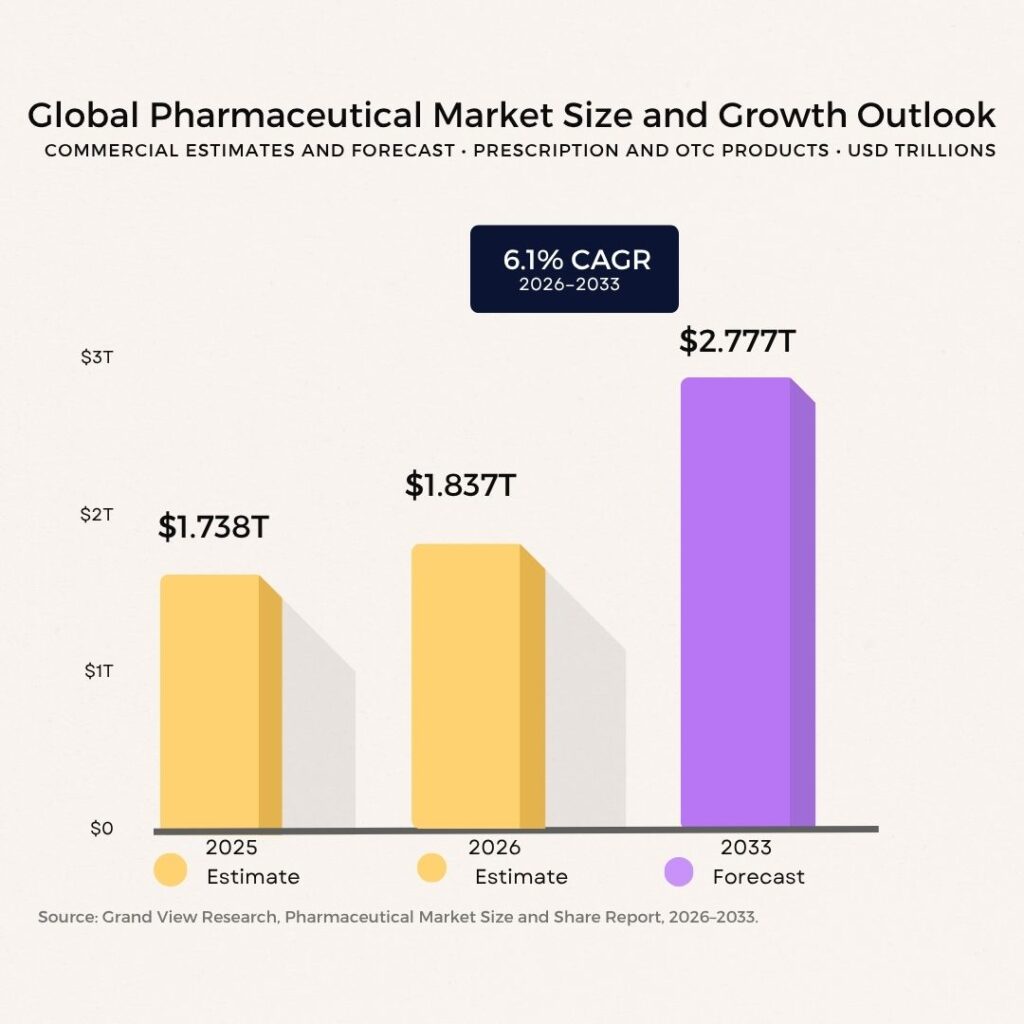
The global pharmaceutical market was estimated at $1.738 trillion in 2025 and is expected to reach $1.837 trillion in 2026. It is forecast to grow further to $2.777 trillion by 2033, representing a 6.1% compound annual growth rate from 2026 to 2033. These figures cover both prescription and over the counter pharmaceutical products.
Pharmaceutical R&D and Clinical Development Statistics
Getting a new medicine through R&D takes serious money, years of trials, and no guarantee of success at the end. The numbers below cover what’s being spent, who’s doing the work (increasingly, outsourced partners), what a drug actually costs to develop, how the FDA’s workload looks, and where AI is starting to change the odds.
Global Pharma R&D Spending and CRO/CDMO Outsourcing Growth
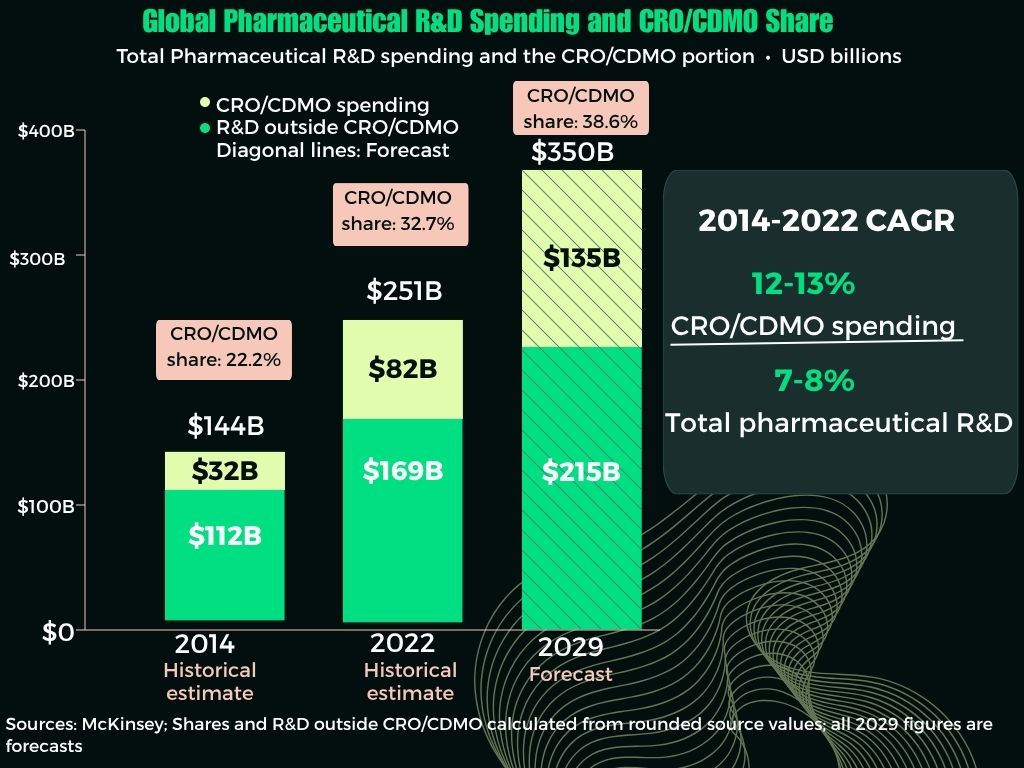
- $144B → $251B → $350B — global pharmaceutical R&D spending in 2014, 2022, and forecast for 2029.
- 12%–13% vs. 7%–8% — annual growth in CRO/CDMO spending vs. total pharma R&D spending, 2014–2022.
- 22.2% → 32.7% → 38.6% — CRO/CDMO’s calculated share of total pharma R&D in 2014, 2022, and forecast for 2029.
Cost to Develop and Approve a New Drug
$708 million median / $1.31 billion mean — estimated R&D cost per FDA-approved drug (38-drug 2019 cohort, 2019 USD; includes cost of capital and failed programs).
FDA Clinical Development Activity in 2025
- ~12,300 clinical-development protocols received by CDER — over 600 more than in 2024.
- 3,000+ Investigational New Drug (IND) applications received.
- 4,500+ sponsor meeting requests submitted to CDER.
Drug Approval Probability from Phase I
- 6.7% average probability a new Phase I drug program eventually reaches approval (2014–2023 data).
- 28% of Phase II programs advance to Phase III — the single biggest drop-off point in development.
AI in Drug Discovery
- 80%–90% Phase I success rate reported for AI-discovered molecules in an early, small sample (21 of 24) — later-stage evidence remains limited.
- 30%–50% shorter modeled time to reach a preclinical candidate in AI-enabled discovery workflows.
- $60B–$110B per year: McKinsey’s modeled economic opportunity from generative AI across pharma and medical products.
Regional and Therapeutic-Area Trends
- 41.8% North America’s share of global pharma revenue in 2025 — the largest regional market.
- 7.06% CAGR Asia Pacific’s forecast growth rate through 2033 — the fastest-growing region.
- 18.6% cancer’s share of 2025 global pharma revenue — the largest single disease segment.
Obesity as a Major Pharmaceutical Demand Driver
- 16.2% global adult obesity prevalence in 2024 — up from 12.1% in 2012
- $13.542 billion Eli Lilly’s 2025 Zepbound revenue, up 175% year-over-year.
- DKK 82.347 billion Novo Nordisk’s 2025 obesity-care sales, up 26% in reported currency (31% at constant exchange rates).
These figures use different currencies, reporting scopes, and measurement bases. They should not be added together, and revenue should not be interpreted as profit.
Top 5 Leading Pharmaceutical Businesses: Revenue Comparison
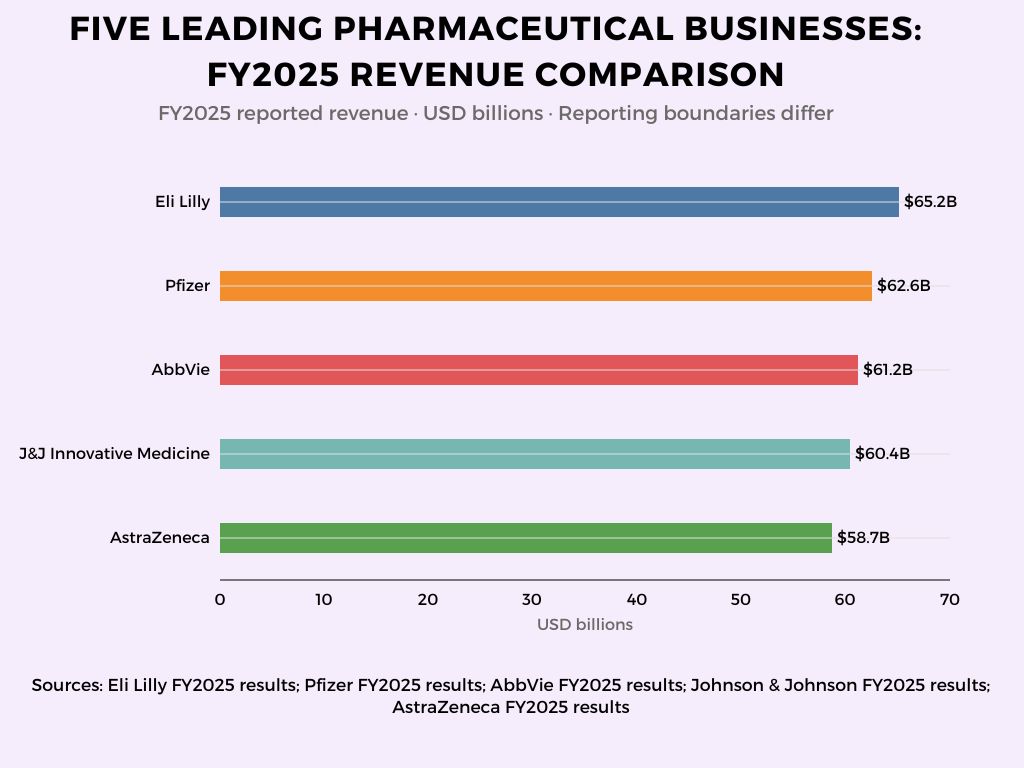
Reporting boundaries differ by company — this is a defined revenue comparison, not a universally standardized ranking.
Pharmaceutical Manufacturing, Supply, and Access Statistics
Getting a medicine approved doesn’t guarantee patients can actually get it. That comes down to where ingredients are sourced, where manufacturing happens, and whether supply keeps up with demand. Below: how concentrated API sourcing really is, what Europe’s producing, and why U.S. shortages haven’t gone away.
Geographic Concentration of Active API DMFs
- Active pharmaceutical ingredient Drug Master Files supporting medicines for the U.S. market remain geographically concentrated.
- India held 48% of active API DMFs, followed by China at 18%, the EU at 16%, and the United States at 8%.
- Among new API DMF filings in 2024, China accounted for 45%, compared with India’s 43%.
- India remained the leader in total active DMFs, while China led new filings in 2024.
Note: DMF shares describe the geographic distribution of regulatory files, not API production volume, factory capacity, or medicine output.
European Pharmaceutical Production
Pharmaceutical production across EFPIA-tracked countries totalled €463.9 billion in 2024 and was estimated to reach approximately €505 billion in 2025.
Active U.S. Drug Shortages
- 227 active shortages: End of June 2026.
- 323 active shortages: Record count reached in the first quarter of 2024.
- 48% of new shortages involved sole-source products: January–June 2026.
- 16% of active shortages involved controlled substances: End of June 2026.
The number of shortages does not measure patient impact by itself. One shortage involving a widely used medicine may affect more patients than several shortages involving lower-volume products.
Frequently Asked Questions
How big is the global pharmaceutical market in 2026?
Global pharmaceuticals market is estimated at $1.837 trillion in 2026, covering prescription and over-the-counter medicines. North America was the largest regional market, accounting for an estimated 41.8% of global revenue in 2025.
How much does it cost to develop a new drug?
A study of 38 medicines approved by the FDA in 2019 estimated a median development cost of $708 million and a mean cost of $1.31 billion per approved drug. The estimates include capital costs and spending on unsuccessful development programmes.
What percentage of drugs progress from Phase I to approval?
Approximately 6.7% of new drug programmes entering Phase I eventually reach approval, based on clinical-development transition data from 2014–2023.
What is the difference between an FDA approval and an EMA recommendation?
An FDA approval authorises a medicine for the U.S. market. An EMA recommendation is a scientific opinion on whether a medicine should receive EU marketing authorisation and is generally followed by a separate European Commission decision. These figures represent different regulatory actions and should not be added or directly compared.
What is the difference between CTD and eCTD?
The Common Technical Document, or CTD, defines how regulatory information is organised into five modules. The electronic Common Technical Document, or eCTD, is the digital format used to submit, review, update, and manage that information throughout the application lifecycle.
What is GMP in pharmaceutical manufacturing?
Good Manufacturing Practice, or GMP, refers to the quality requirements used to ensure that medicines are consistently manufactured, tested, and controlled according to appropriate standards. GMP covers areas such as documentation, manufacturing controls, validation, quality control, data integrity, deviations, and corrective actions.
What is the difference between a generic drug and a biosimilar?
A generic medicine contains the same active ingredient as an approved reference chemical drug and is generally required to demonstrate pharmaceutical equivalence and bioequivalence. A biosimilar is a biological medicine that is highly similar to an approved reference biologic, with no clinically meaningful differences in safety, purity, or potency.
Why do drug shortages continue in the United States?
Drug shortages can result from manufacturing disruptions, quality problems, limited production capacity, ingredient shortages, and reliance on sole-source suppliers. At the end of June 2026, 227 active U.S. drug shortages were reported, and 48% of new shortages recorded during the first half of 2026 involved sole-source products.
Methodology and Sources
Source selection: Primary sources such as FDA, EMA, EFPIA, WHO, official company reports, and valid studies were used available online .